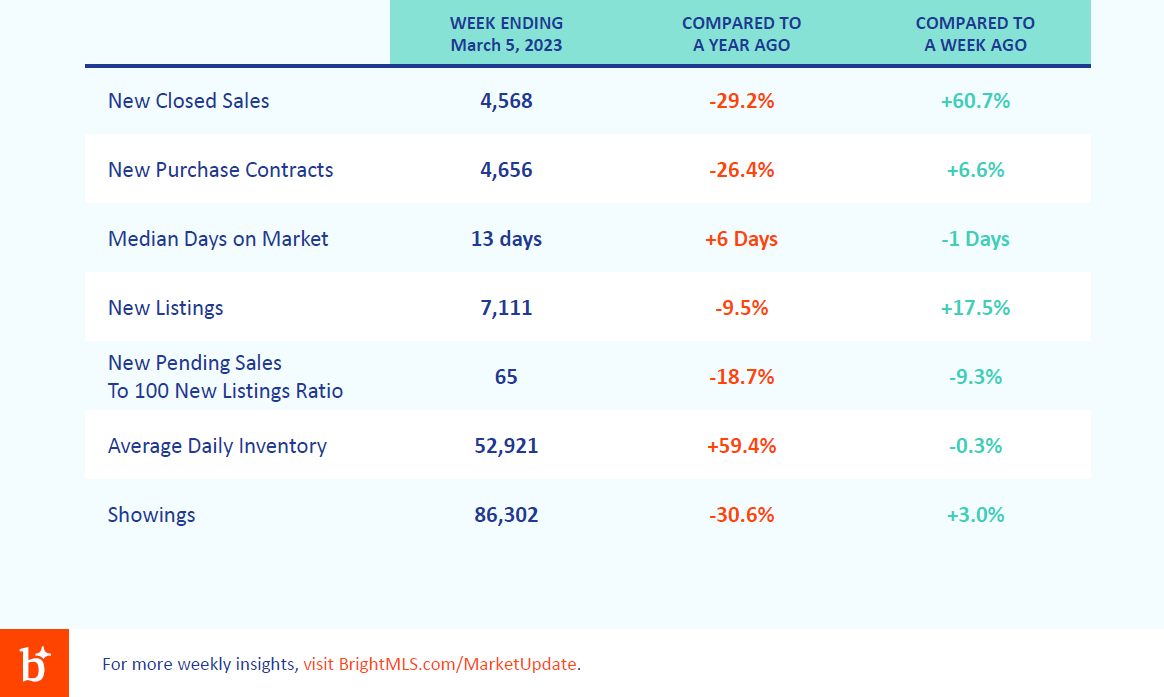
Here are the highlights for the week ending March 5, 2023:
- End-of-month jump in Closed Sales. Closed sales for the week ending March 5 surpassed the number in 2019 and 2020. And the week saw over 60% more sales than the prior week. Why? Weekly closed sales metrics tend to show a spike at the end of the month. The difference in days the weeks capture – the final days of February are included in this week for 2023 and 2022 while they were in the preceding week for 2019-2021 – are responsible for 2023’s rise. The expectation is a dip in closed sales next week, as activity at the beginning of the month is typically lower.
- Showings continue to mirror 2019. Showings increased 3% week-over-week, the second weekly gain. Showing activity resembles the numbers the Bright footprint reported for 2019. Although there have been times above (week ending Feb. 19) and times below (week ending Feb. 26), it is an indicator of solid demand. Mortgage interest rates are significantly higher than last year, above 6%, as well as elevated compared to the 4% range in 2019.
- Time to contract dropping from the beginning of the year. The week ending March 5, 2023, had median days to contract of 13 days. This figure is less than half the 28 days for the first week of the year. Buyers gained negotiating ground as interest rates rose, and some consumers had to move to the sidelines. Competition is strong for attractive and well-priced homes. Many homes are moving off the market quickly in the Bright footprint, and as seen in the past two reports, half are only available for two weeks or less.
Information compiled by Lisa Sturtevant, PhD


 Facebook
 X
X
 Pinterest
 Copy Link


